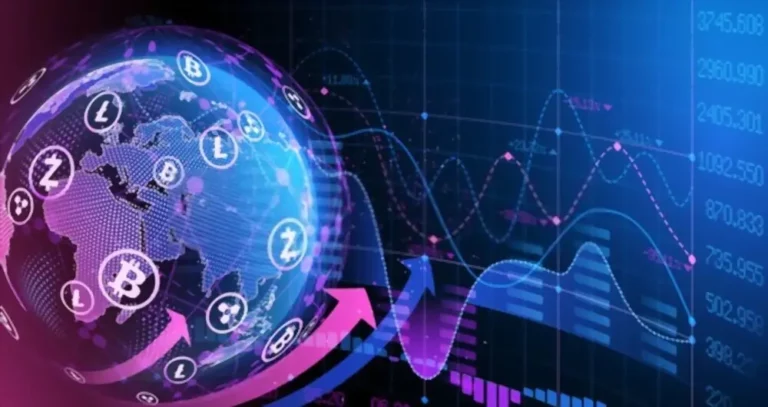
How to Read Crypto Charts- Ultimate Guide
The most common crypto price chart indicator is a candlestick, and If you have read crypto charts, then you might know that the easiest way to read charts is by candlesticks.
A clear representation of price action can be seen in them. The charts display several timeframes at the same time. This article will let you know how to read crypto charts by candlesticks.
Reading Crypto Charts
Here is a visual representation of a candle stick that helps you in understanding How to Read Crypto Charts.
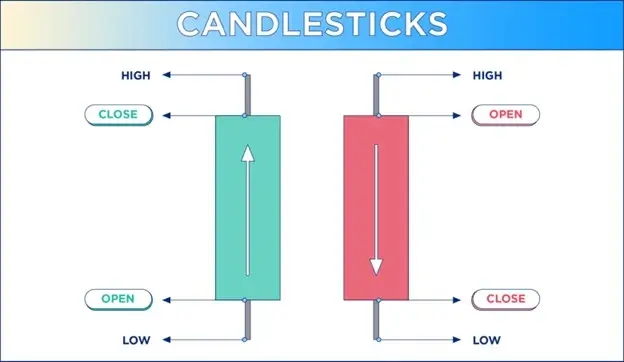
Candlesticks describe each time frame. If this chart is arranged to a four-hour timeframe. All re candlesticks will represent almost four hours of trading activity. A candlestick is comprised of nearly two main bars:
1. Thicker part
It displays assets of starting and closing prices.
2. Thinner part
It describes the highest and lowest price points. It is also known as “wick.” Usually, in most crypto charts, a green candle indicates a price increase. At the same time, a red candle shows a price decrease. The other scenario is that if the candlestick has no body as well as long wicks is a clear indicator that buyers and sellers both are out of control.
Meanwhile, The size, shape, color, and timings of these candlesticks and the patterns they produce give you some hints related to future price action. They allow investors to invest in some lucrative future markets and take positions for better profit in the future.
How to Read Crypto Charts Using Basic Indicators?
What if the price increases, but you are unaware of it? Then, you would lose a great opportunity. If you do this, you will lose money instead of making money. It requires a strong strategy because direction and timing matter the most, So you must know How to Read Crypto Charts and use some indicators that will keep you updated about the ups and downs in the crypto market.
But reading and understanding those indicators are more important. Following are some of the fundamental indicators as well as patterns to read it:
Indicators
Not everyone can correctly predict the fluctuations in the rise and fall of crypto. As quickly the price falls, it can be increased as well. But, some investors acknowledged the variations in trends and experts in their niches. But they also use indicators to use predict correctly.
As an investor, you must have some indicators for correct predictions, as you know that predictions, timings, and discipline are the main element. You can use these indicators to understand crashes and retracements.
- The average directional index (ADX) displays the strength of Trent Bollinger Bands and indicates the price over a relative basis.
- Standard deviation displays the historical validity of the shares and investments.
- The relative strength index (RSI) indicates price changes.
Here are the two most famous crypto indicators that are as follows:
1. Moving Averages
Firstly make sure that Moving averages do not analyze short-term price fluctuations. During a specific period, daily prices are averaged to create a line. This line sometimes passes through the price chart. Trading in real-time cryptocurrency charts is also adapted to give some beneficial signals.
2. Support and Resistance Level
Interpreting crypto charts requires an understanding of support and resistance levels. It is crucial to understand crypto charts. While a pullback and supports level are price points on which cryptos are expected because of the concentration of purchasing interest.
Meanwhile, a price level concentrated at selling stakes is referred to as a resistance level. Therefore, investors prefer buying at support levels and selling at resistance levels.
Patterns
Following are some of the patterns that help in understanding the rise and fall in the Crypto market:
1. Hammer Candle Pattern
It is one of the most popular crypto pattern trading patterns. ‘Bullish indicates that investors are interested in the markets nowadays and trying to buy and come into it. At the same time, the extended bottom wick displayed in the picture describes the hammer’s handle. At the same time, the whole candle’s body tells the hammer’s head.
2. Head and shoulders
Head and shoulders are considered trend reversal patterns visible at the top and middle of a trend. Whenever A bullish ‘head and shoulders’ appears, it indicates that the crypto price will increase rapidly. You will watch the tug of the watch between purchasers and sellers.
3. Wedges
Another vital pattern, “Wedges,” displays a fashion waning in popularity is being used. By connecting the lower points of price movement and another line that follows the price peaks, wedges can easily be made.
When those two lines connect from left to right, you have a wedge. A bullish wedge is a clear sign of going in the correct direction. Meanwhile, a cryptocurrency may be followed by a bearish wedge.
FAQs
1: What is the tip for newbies to manage risk?
Don’t invest your entire savings in a single cryptocurrency, so if you lose in any of them, at least you have something at the back for stability.
2: What is the head and shoulders wedge considered?
Head and shoulders are considered trend reversal patterns visible at the top and middle of a trend.
3: What is not analyzed by the moving average?
Moving averages do not analyze short-term price fluctuations.
Conclusion
These are the most helpful thing in the world of crypto as it helps in forecasting price all the time. If you are an investor, it might help you buy and sell trades at the correct time and great price. You will get to learn multiple techniques related to crypto.
If you have read crypto charts, you might know that the easiest way to read charts is by candlesticks. Using them, you can see how prices are moving clearly. It is my hope that you have learned how to read crypto charts from this article.